In 2016 I am again taking part in GSoC with the continuation of the project. Last year I was adding profiling backends and custom metrics support for Apitrace (so the CLI side), whereas this year I’m in for developing new profiling GUI for QApitrace.
At the time of writing it is the week of mid-term evaluations of GSoC project. In this post I am describing the work so far.
- Some test coverage
The first item is not actually related to the GUI. Last year addition to Apitrace in the form of profiling backends was quite a large amount of code, moreover it relied on the multi-pass (running retrace several times successively) feature, which could possibly be problematic due to invalid assumptions done in globals within glretrace part of Apitrace. Hence, some sort of the feature test coverage was needed.
Profiling results (also available set of metrics) are highly dependent on the hardware used. So it was only possible to come up with some bare minimum amount of test coverage. https://github.com/trtt/apitrace-tests
Strictly speaking, it is utilizing only one metric (‘drawn pixels’ as it appears in different backends) to test it consistency between different passes and such.
In process it was found that globals in glretrace indeed cause some problems with multi-pass. Actually, what was found is a very minor issue — different behavior of the first call in different passes due to the same visuals (simply put, a window) used in retracing in not-resetting global variable. I made some attempts (to be honest, not so greatly successful) to fix this issue, but apparently it’s still not very clear what to do with it. Currently I’m trying to discuss this situation on the mailing list with Apitrace author José Fonseca.
- GUI
Meanwhile, I started the actual work on the GUI part. The first thing to address this year — means of data visualization.
It was the most problematic place last year when I tried to begin the work on the GUI. There were no readily available solutions for drawing plots that I could make use of. Ideally I would need something with QML support, histograms (bar charts), timelines (gantt charts), some specific user interaction types support and, finally, something that works fast enough. This year there were some pretty good candidates, namely, QtCharts (becoming open-source with Qt 5.7 release) and timeline lib in Qt-Creator. I spent some time examining them. Unfortunately, QtCharts, for example, has some sort of GL-acceleration support only for simple line plots (and is very slow otherwise), and there are many other restrictions with these solutions. More importantly, they all are licensed under GPLv3, this fact alone makes it impossible to use them in MIT-licensed Apitrace (I wish I realized this thing earlier).
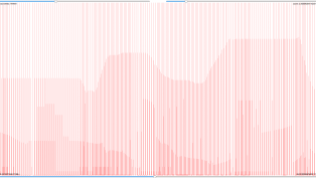
So I’m inevitably back to designing some custom solution for charts. I went on implementing the idea suggested by my GSoC mentor Martin Peres (mupuf). It is basically an OpenGL routine that uses textures for holding data and instanced drawing for performance. Current development is happening here: https://github.com/trtt/bargraph
It worked out pretty well, it’s able to maintain at least 100 fps with large data sets. The major drawbacks are: only 2^31 events supported, pretty high RAM usage (also GPU memory). But it looks like it’ll fit all the needs of the project nevertheless. There are still many things to work on: designing proper QML element, convenient controls, axes, handling multiple charts, extending to timelines, preliminary filtering support, tooltips etc. And that is only considering charts, so there’s really a lot of work lying ahead.

